Powerful Debugging Tools for Spark for Azure HDInsight
Microsoft runs one of the largest big data cluster in the world – internally called “Cosmos”. This runs millions of jobs across hundreds of thousands of servers over multiple Exabytes of data. Being able to run and manage jobs of this scale by developers was a huge challenge. Jobs with hundreds of thousands of vertices are common and to even quickly figure out why a job runs slow or narrow down bottlenecks was a huge challenge. We built powerful tools that graphically show the entire job graph including the various vertex execution times, playback etc. which helped developers greatly. While this was built for our internal language in Cosmos (called Scope), we are working very hard to bring this power to all Spark developers.
Today, we are delighted to announce the Public Preview of the Apache Spark Debugging Toolset for HDInsight for Spark 2.3 cluster and forward. The default Spark history server user experience is now enhanced in HDInsight with rich information on your spark jobs with powerful interactive visualization of Job Graphs & Data Flows. The new features greatly assist HDInsight Spark developers in job data management, data sampling, job monitoring and job diagnosis.
Spark History Server Enhancements
The Spark History Server Experience in HDInsight now features two new tabs: Graph and Data.
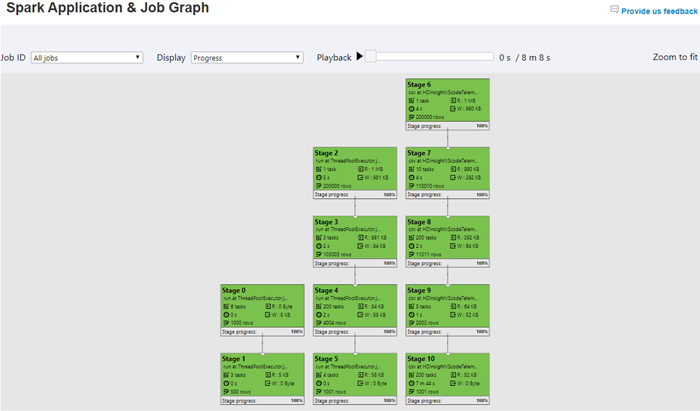
Graph Tab – Job graph is a powerful interactive visualization of your jobs. This interface enables innovative debugging experiences such as playback, heatmap by progress of job stages, read, written for Spark application and individual jobs.
The Spark job graph displays Spark job executions details with data input and output across stages. For completed jobs, the Spark job graph allows Spark developer to playback the job by progress, data read and written with details. You can now dwell in Spark job diagnosis around performance, data and execution time using this experience which articulates various stage outliers.
Data Tab – Job specific input, output data view, search, download, preview, data copy, data URL copy, data export to CSV, as well as table operations view are visualized in the data tab.
As a developers or data scientist, you can perform various actions such as preview, download, copy and export to CSV file of the data. You can also come here to partially download data as sample data for your local run and local debug. Metadata interpretation and correlation has always been a challenge in debugging. A cool feature has also been added around Table Operations, you are able to view the Hive metadata, investigate table operations at each stage to gain more insights for better troubleshooting and spark job analysis.
Developer Nirvana
HDInsight Spark developers can greatly increase their productivity by leveraging these capabilities:
- Preview and download Spark job input and output data, as well as view Spark job table operations.
- View and playback Spark application / job graph by progress, data read and written.
- Identify the Spark application execution dependencies among stages and jobs for performance tuning.
- View data read/write heatmap, identify the outliers and the bottlenecking stage and job for Spark job performance diagnosis.
- View Spark job/stage data input/output size and time duration for performance optimization.
- Locate failed stage and drill down for failed tasks details for debugging.
Getting Started with Apache Spark Debugging Toolset
These features have been built into HDInsight Spark history server.
Access from the Azure portal – Open the Spark cluster, click Cluster Dashboard from Quick Links, and then click Spark History Server.
Access by URL – Open the Spark History Server.
More features to come
- Critical path analysis for Spark application and job
- Spark job diagnosis
- Data Skew and Time Skew Analysis
- Executor Usage Analysis
- Debugging on failed job
Feedback
We look forward to your comments and feedback. If there is any feature request, customer ask, or suggestion, please send us a note to hdivstool@microsoft.com. For bug submission, please open a new ticket using the template.
For more information, check out the following:
-
Use extended Spark History Server to monitor Spark applications
-
Use Azure Toolkit for IntelliJ to debug Spark applications remotely on an HDInsight cluster
Learn more about today’s announcements on the Azure blog and Big Data blog, and discover more Azure service updates
Source: Big Data


