Faster Metric Alerts for Logs now in limited public preview
I am happy to share the public preview of a new capability – Metric Alerts on Logs for OMS Log Analytics. With this capability, customers can get lower latency alerts from logs. Interested…read on!
Customers rely on alerts in Azure monitoring tools to stay on top of issues. While log alerts are popular, one concern is the time it takes to find the trace patterns and trigger alerts. We are happy to share the limited public preview of the new capability Metric Alerts for Logs that brings down the time it takes to generate a log alert to sub 5 minutes.
The Metric Alerts on Logs preview currently supports the following log types on OMS Log Analytics – heartbeat, perf counters (including those from SCOM), and update. To see full list of the generated metrics from logs, see our documentation. In the near future, we plan to expand this list to include events.
In this blog post, we will walk through the new feature. But first, for those who are curious, we will do a quick peek under the hood to show how it all works.
Monitoring tools rely on telemetry emitted by the underlying resources. This telemetry is in the form of structured data (metrics) or unstructured data (logs). Metrics and logs have different characteristics, and each play a distinct role to play in monitoring. Metrics consist of discrete values that are used for exploration purposes via charts and for alerting on numeric thresholds being met.
On the other hand, logs contain a stream of descriptive data emitted by the resource/app. Customers use the Log Analytics platform to ingest logs and derive insights from these logs via queries, typically for troubleshooting and auditing. Customers also set up alert rules on these logs. The alerting engine runs atop the logs ingested into the Log Analytics platform and checks for criteria specified in an alert rule (via a query). This ingestion process involves batch indexing of the logs, which can take a few minutes. Thus, while using queries to write alert rules on logs is highly flexible, the trade-off is higher latency – at least 10-15 minutes in certain situations. This is generally undesirable to detect issues requiring immediate action such as detecting occurrence of events, or for identifying when resources are unavailable by checking for periodic heartbeats, or for monitoring performance.
So, how do we provide faster alerts for these scenarios?
In the examples above, alerting on missed heartbeats or the occurrence of events entails keeping track of the count of specific fields within logs. This is akin to checking the threshold on a metric.
Given this observation, we built the new Metric Alerts on Logs capability, to “marry” the Logs Analytics platform with the new metrics alerting platform, specifically to provide sub 5 minute end-to-end latency for log alerts, with an evaluation frequency as low as a minute. In this solution, logs are converted to metrics as they stream into the Log Analytics platform. These metrics are then pumped into the metrics platform where they can be alerted on. This conversion of metrics avoids the ingestion of logs, hence bypassing any delays incurred during ingestion completely.
Now, let’s now take a look at how Metric Alerts on Logs works.
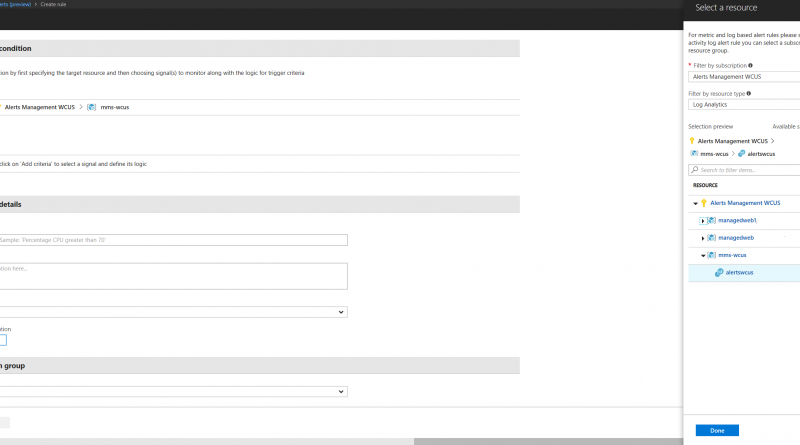
Using the new Unified Alerts experience under Alerts (Preview), alert rules can be set up for workspaces in Log Analytics. To do so, users can select Create Alert Rule > Subscription > Resource Type (Log Analytics) > Resource (Workspace id).
The next step is to select the signal on which to alert. As part of the signal selection, users can define a query, pick from a saved query or pick a metric generated from the log (available in this preview).
Users can select heartbeat, which shows up as a metric in the signal list. When selecting this signal, the effectively same alert rule is created, albeit with much lower latency on the metric generated from the log.
To conclude, the Metric Alerts on Logs preview allows customers the best of both worlds – faster alerting for logs using metrics technology and the ability to leverage Log Analytics for insights.
To take this capability for a spin, sign up for the preview. As always, we would love to hear your feedback, please keep it coming at azurealertsfeedback@microsoft.com.
Source: Azure Blog Feed


