Global performance acceleration with Azure Traffic Manager
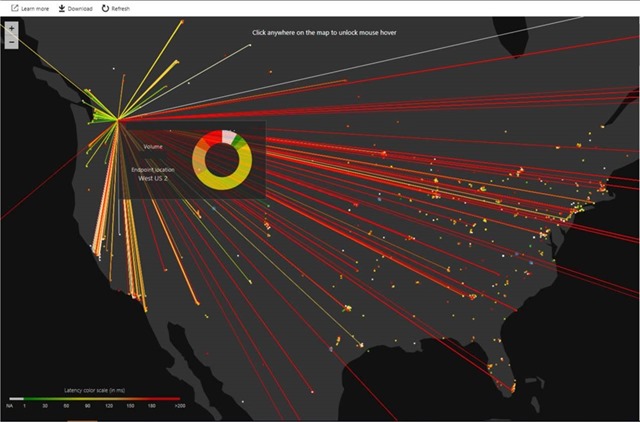
Gaining insights to customer traffic is imperative in providing a best in class user experience. With Traffic View, a new capability in Azure Traffic Manager, you can get rich information and powerful visualization that captures a heatmap of users’ experience. This allows you to understand traffic patterns globally and zoom in on specific geographic locations.
Improve performance by leveraging Traffic View
Today, we are happy to announce the general availability (GA) of Traffic View, announced in public preview last fall. Since then we have received enthusiastic adoption and feedback. Insights provided by Traffic View include geographic location of your user base, latency experienced from these locations, and volume of traffic. These insights can then be used to optimize placement of your workloads in various Azure regions. You can use the visualizations provided through the Azure portal or you can download the raw data to do custom analysis with Power BI or similar tools.
To provide finer granularity, Traffic View can now be enabled at a profile level rather than subscription level. Starting this week, as we rollout the changes, you will have to re-enable Traffic View for the profiles you need. Traffic View will be charged starting May 1, 2018. You will only pay for the profiles you have enabled and the cost is based on the amount of data points processed to create the Traffic View. Please visit the Azure Traffic Manager pricing page for detailed pricing information.
Increasing performance routing accuracy for your users
Azure Traffic Manager’s performance routing method will ensure users are routed to the location that is nearest (minimal latency) to them. This is done by collecting network latency measurements from different subnets across the Internet to all Azure regions. In the vast majority of cases, these measurement locations overlap with the locations of your users. However, if you have an end user base that spans outside of this, Azure Traffic Manager can help you route them to the best Azure region by incorporating measurements that are taken from those specific users.
The first step in that process is identifying if you have users in locations where such additional latency information needs to be collected. Traffic View can provide this data since it records the locations from where your users are connecting to Azure, the latency information associated with that location, and the Azure region they were directed to. If that information is missing from the Traffic View data, then you can move on to the next step of providing this measurement data from your users.
Last fall during the Ignite conference we announced the public preview of Real User Measurements, which allows customers to embed an Azure provided JavaScript tag in their web property. When a user renders this tag, or uses the mobile application, measurements are taken from that device against Azure regions, reported back to Azure, and added to our network latency intelligence map. Thus, when one of your users connects from a location where new measurements were taken, the accuracy of the routing decision by Azure Traffic Manager increases, leading to an improved performance experience for your users.
We are thrilled to announce that Real User Measurements is now generally available for all Azure Traffic Manager customers. You can use the Azure portal to obtain the Real User Measurements JavaScript tag that can be embedded in your web site. There are no additional steps required to experience the increase in accuracy of performance routing for your users. As part of this GA announcement, we will be charging customers for their Real User Measurements usage starting on May 1, 2018. More details about Real User Measurements pricing can be obtained from the Azure Traffic Manager pricing page.
To get started on using these exciting features, please visit the Azure Traffic Manager getting started tutorial.
Source: Azure Blog Feed

