Workload insights into SQL Data Warehouse delivered through Microsoft Azure Monitor diagnostic logs
SQL Data Warehouse (SQL DW) now enables enhanced insights into analytical workloads by integrating directly with Microsoft Azure Monitor diagnostic logs. This new capability enables developers to analyze workload behavior over an extended time period and make informed decisions on query optimization or capacity management. SQL DW is a flexible, secure, and fully managed analytics platform for the enterprise optimized for running complex queries quickly across petabytes of data.
Today, customers leverage Dynamic Management Views (DMVs) to get insights into their data warehouse workload. These DMVs have a limit of 10,000 rows that can easily be exceeded for intensive enterprise data warehouse workloads with heavy query activity. Relying solely on DMVs hinders or blocks many query troubleshooting scenarios for active workloads. To work around this DMV limitation, custom logging solutions were required which consumed internal system resources, increased the total cost of the data warehouse solution, and introduced additional development complexities and maintenance effort.
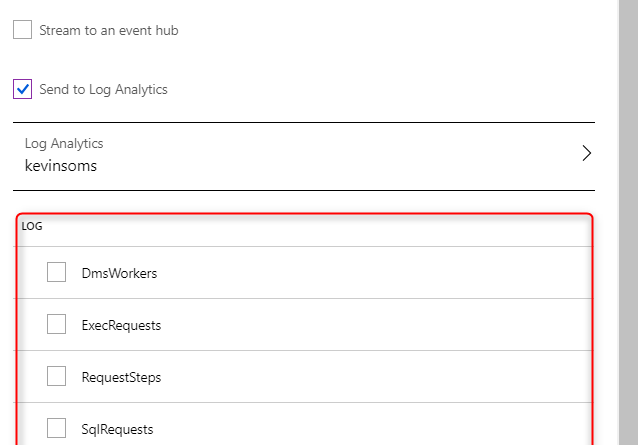
We have now introduced an external logging process through Azure Monitor diagnostic logs, which provides additional insights into your data warehouse workload. With a single click of a button, you are now able to configure diagnostic logs for historical query performance troubleshooting capabilities using Log Analytics. Azure Monitor diagnostic logs support customizable retention periods by saving the logs to a storage account for auditing purposes, the capability to stream logs to event hubs near real-time telemetry insights, and the ability to analyze logs using Log Analytics with log queries. Diagnostic logs consist of telemetry views of your data warehouse equivalent to the most commonly used performance troubleshooting DMVs for SQL Data Warehouse. For this initial release, we have enabled views for the following:
- sys.dm_pdw_exec_requests
- sys.dm_pdw_request_steps
- sys.dm_pdw_dms_workers
- sys.dm_pdw_waits
- sys.dm_pdw_sql_requests
Configure diagnostic logs to emit to Log Analytics:
 Set log alerts to dynamically scale your data warehouse using action groups integrated with Azure Function:
Next steps
- Visit our online documentation for more details on Azure Monitor logs.
- For feature requests, please vote on our UserVoice.
- Create an Azure SQL Data Warehouse to get started today.
- Stay up-to-date on the latest Azure SQL Data Warehouse news and features by following us on Twitter @AzureSQLDW.
Source: Azure Blog Feed

