Time series analysis in Azure Data Explorer
Azure Data Explorer (ADX) is a lightning fast service optimized for data exploration. It supplies users with instant visibility into very large raw datasets in near real-time to analyze performance, identify trends and anomalies, and diagnose problems.
ADX performs an on-going collection of telemetry data from cloud services or IoT devices. This data can then be analyzed for various insights such as monitoring service health, physical production processes, and usage trends. The analysis can be performed on sets of time series for selected metrics to find a deviation in the pattern of the metrics relative to their typical baseline patterns.
ADX contains native support for creation, manipulation, and analysis of time series. It empowers us to create and analyze thousands of time series in seconds and enable near real-time monitoring solutions and workflows. In this blog post, we are going to describe the basics of time series analysis in Azure Data Explorer.
Time series capabilities
The first step for time series analysis is to partition and transform the original telemetry table to a set of time series using the make-series operator. Using various functions, ADX then offers the following capabilities for time series analysis:
- Filtering – Used for noise reduction, smoothing, change detection, and pattern matching.
- Regression analysis – Used for trend change detection in streamed data.
- Seasonality detection – Used to automatically detect or validate seasonal or periodic patterns in each time series.
- Element-wise functions – Used to perform arithmetic and logical operations between two time series.
The complete set of functions for time series analysis can be found in the machine learning and time series analysis section of our documentation.
Example of a time series analysis query
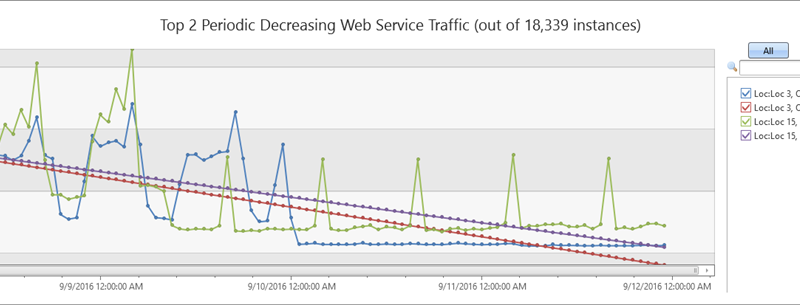
The following query uses series_periods_detect and series_fit_line for time series analysis and discovery of periodic patterns and decreasing trends:
let min_t = toscalar(demo_many_series1 | summarize min(TIMESTAMP));
let max_t = toscalar(demo_many_series1 | summarize max(TIMESTAMP));
demo_many_series1
| make-series reads=avg(DataRead) on TIMESTAMP in range(min_t, max_t, 1h) by Loc, Op, DB
| where series_partial_sf(reads, 0) == false
| extend (p, ps)=series_periods_detect(reads, 0, 24, 1)
| mvexpand p to typeof(double), ps to typeof(double)
| where ps > 0.7
| extend series_fit_line(reads)
| top 2 by series_fit_line_reads_slope asc
| render timechart with(title='Top 2 Periodic Decreasing Web Service Traffic (out of 18,339 instances)')
In this query, Azure Data Explorer analyzes 18,339 time series of web service traffic and extracts those with a periodic pattern. Out of this subset, ADX looks for those instances with a decreasing trend. This entire processing takes only about one minute.
Additional information
For a step-by-step walkthrough of time series analysis capabilities read “Time series analysis in Azure Data Explorer.” This topic shows you how to create a large set of time series followed by typical series processing to detect anomalous patterns in specific time series instances.
Our time series functions and capabilities continue to grow. New powerful black box functions for anomaly detection and forecasting are being released. Stay tuned for my next blog to discover additional functions and analysis methods.
To find out more about Azure Data Explorer you can:
- Try Azure Data Explorer in preview now.
- Find pricing information for Azure Data Explorer.
- Learn more about Azure Data Explorer by reading the blog post, “Introducing Azure Data Explorer.”
Source: Azure Blog Feed

