Proactively monitoring cloud operations with Microsoft Azure Stack
Introduction
As an Azure customer, you enjoy its capability to deploy and manage workloads across many different services and regions. You are responsible for managing those Azure resources, including monitoring for problems. However, the underlying hardware and software supporting Azure (e.g. Azure’s physical hosts and network) are managed and monitored by Microsoft engineers.
Azure Stack runs as an integrated system in your own datacenter so the model is different. When you adopt Azure Stack, you enjoy the same capability to provision and consume workloads, but because Azure Stack services and hardware reside in your datacenter, you are responsible for managing and monitoring the Azure Stack environment to ensure system health and reliability. These tasks are taken care of by a new role in your organization – the Azure Stack operator.
The role of the Azure Stack operator
The Azure Stack operator is responsible for the integration, service provisioning, and life cycle of Azure Stack. Because Azure Stack is deployed as a hyper-converged, integrated system, it behaves like an appliance. As an appliance, many of the complexities and deep subject matter expertise of previous cloud technology solutions are minimized.
Once the solution is deployed in your datacenter, most regular maintenance tasks of the Azure Stack operator are typically isolated or infrequent configuration tasks such as managing plans and quotas and provisioning and managing Azure services and content. A big part of the Azure Stack operator’s role is responding to changes or issues within the datacenter.
In Azure Stack, we expect the Azure Stack operator’s work to be driven largely by alerts related to changes or issues. We have designed the monitoring and health system of Azure Stack so that Azure Stack operators get effective and relevant alerts along with specific remediation actions. The alerts inform the Azure Stack operator about the status of the Azure Stack infrastructure and provide directions for what actions are required.
Monitoring Azure Stack software infrastructure
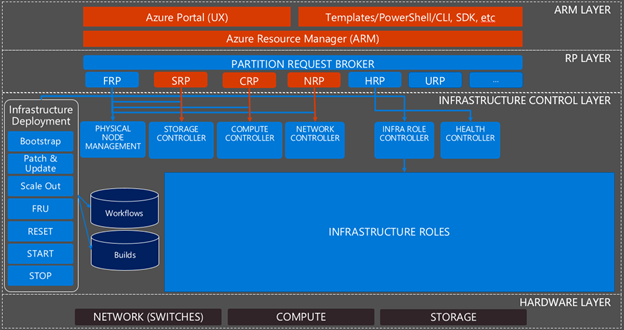
When discussing monitoring and the Azure Stack software infrastructure, we typically talk about the following layers:
- Azure Resource Manager (ARM) layer. The public and administrative portals, the ARM APIs, and the ARM components which implement those APIs.
- Resource Provider (RP) layer. The foundational RPs that offer Azure Resources (e.g. IaaS services) to tenants as well as the Azure Stack specific RPs to provide infrastructure management capabilities such as the Health RP (HRP), which provides health state and alerting information.
- Infrastructure control layer. The infrastructure roles that handle the requests from the RPs and turn them into actions within the system. The infrastructure roles don’t need regular management but may require a restart in certain circumstances. The infrastructure roles are supported by infrastructure role instances, which likewise may require a restart in certain circumstances.
- Hardware layer. The network switches and servers that make up the computing and storage devices in Azure Stack.
Figure 1 provides an overview of the various layers and components of Azure Stack.

Figure 1 – Overview of Azure Stack infrastructure
To monitor the Azure Stack software infrastructure (the three top layers in the picture above), we use the Azure Monitoring agent. It collect events specific to each component and forwards them to local Azure Stack storage accounts in the default provider subscription. The Health RP and its services then raise alerts for those events, which are visible in the Azure Stack portal and available through both a Rest API or PowerShell query.
When issues arise, it is the Azure Stack operator’s responsibility to resolve it quickly to avoid or minimize impact to their tenants. To help Azure Stack operators get to the root of the issue faster, we designed and reviewed the component alerts for content and severity, consistency, and to ensure that each alert offers a clear understanding of impact and the steps necessary to resolve the issue.
As an example of an alert scenario with clear actions for the Azure Stack operator, see Figure 2 below. This alert informs the Azure Stack operator that one of the infrastructure role instances is unavailable and provides the ability to click on “AZS-CA01” to navigate directly to the blade which will allow them to take the start or restart actions.

Figure 2 – Azure Stack Alert Example
Other examples of alerting scenarios for the Azure Stack infrastructure software includes:
- RP and infrastructure role availability
- Capacity of compute memory, storage, and available public IPs
- Node availability
Monitoring Azure Stack hardware components
The Azure Stack operator is also responsible for maintaining the health of the Azure Stack hardware components. The monitoring solution exposed by the Health RP handles the health state and alerting for the Azure Stack software infrastructure. For the lower levels of that stack, it has a subsystem to provide alerts for failed physical disks, network cards, and nodes, shown in Figure 3.
For hardware monitoring of the nodes (physical servers) an external solution is available from Azure Stack solution providers. These solutions monitor the nodes using agentless communication with the base board management controllers to raise alerts for failed power supplies, fans, temperature sensors, and other standard node hardware monitoring.
Similarly, the network switches also require external monitoring using datacenter monitoring tools either in your environment or acquired through the Azure Stack solution provider.
Monitoring hardware using an external solution is a best practice to ensure that alerts occur in cases where hardware failure(s) result in a software failure that delays or prevents alert generation.

Figure 3 – Hardware monitoring overview
Integrate with datacenter monitoring systems
Azure Stack is a fully integrated system. It does not allow the installation of any agent on its physical or infrastructure components (tenants are able to add any agent they want to their tenant VMs). When integrated into customers’ existing management systems, Azure Stack is surfaced as a single (integrated) system, the underlying components are not exposed. Said another way, the internals of Azure Stack are internal.
For customers to get a single view of all alerts from their Azure Stack deployments and devices, as well as to integrate alerts into existing IT service management workflows for ticketing, Azure Stack supports integration with external datacenter monitoring solutions using either the Health RP Rest API or PowerShell access.
An example of integration support for monitoring Azure Stack deployments using Nagios was provided with an open source connector available to download from Nagios plug-in directory. Additionally, support for monitoring Azure Stack deployments with System Center Operations Manager is also available with the Azure Stack Management pack.
Figure 4 below demonstrates the integration point of the Health RP alerts, network switches, and hardware monitoring.

Figure 4 – Azure Stack integration with datacenter monitoring systems.
Next steps
Download and install Azure Stack Development kit today and get familiar with viewing alerts and health. To learn more about how to find alerts in Azure Stack, see Monitoring health and alerts in Azure Stack.
More Information
At Ignite this year in Orlando, we will have a series of sessions that will educate you on all aspects of Azure Stack. See our list of sessions and register here.
For more information on operating and monitoring Azure Stack check out this session, BRK3127 Operating principles of Azure Stack.
We are always looking for feedback and if you want to talk to us directly please sign up here.
Source: Azure Stack