Performance best practices for using Azure Database for PostgreSQL
Microsoft announced the public preview of Azure Database services for PostgreSQL and MySQL at Build 2017 which is a simple, fully managed database service for PostgreSQL and MySQL that removes the complexities around infrastructure management, data availability, protection, and scale. The service has seen tremendous growth and we have had customers reaching out to us regarding best practices for achieving optimal query performance on the service. This post outlines an approach for troubleshooting performance while using Azure Database for PostgreSQL as the backend database.
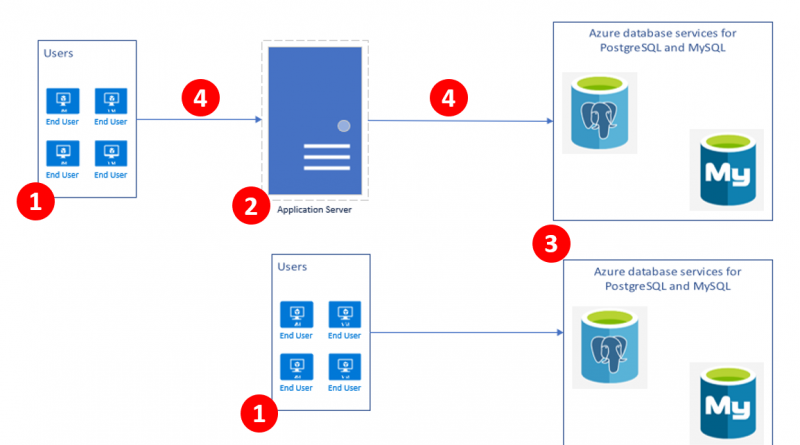
Based on the usage patterns, we see two common deployment patterns:
- An application server exposing a web endpoint on an application server, which connects to the database.
- A client-server architecture where the client directly connects to the database.

The performance issues for an application or service using Azure Database for PostgreSQL service can be classified broadly into the following categories. Pleas refer numbers in the bulleted section below for more details.
1. Resource contention (CPU, Memory, and Disk) on the client – The machine/server serving as the client could be having a resource constraint which can be identified in the task manager, the Azure portal, or CLI if the client machine is running on Azure.

2. Resource contention (CPU, Memory, and Disk) – The machine/server acting as the application server could cause a resource constraint, which can be identified in the task manager, the Azure portal, or CLI if the application server/service VM is running on Azure. If the application server is an Azure service or virtual machine, then Azure metrics can help with determining the resource contention.
3. Resource contention on Azure Database for PostgreSQL – The database service could be experiencing performance bottlenecks related to CPU, memory, and storage which can be determined from the Azure Metrics for the database service instance. Please see below for more details. To learn more, read about monitoring Azure Database for PostgreSQL.

4. Network latency – One of the common issues we encounter while troubleshooting performance is the network latency between the client and the database service instance. A quick check before starting any performance benchmarking run is to determine the network latency between the client and database using a simple SELECT 1 query. We have seen customers report improved throughput when the SELECT 1 timing for a query is <2ms when using a remote client hosted on Azure in the same region and resource group as the Azure Database for PostgreSQL server.
Commands to get SELECT 1 timing using psql:
timing
SELECT;
watch 1
We have observed that customers are able to significantly increase the application throughput by creating the application server and database service in the same region, resource group, and using accelerated networking for the application server/client machine, where applicable. Accelerated networking enables single root I/O virtualization (SR-IOV) to a VM, greatly improving its networking performance. This high-performance path bypasses the host from the datapath reducing latency, jitter, and CPU utilization for use with the most demanding network workloads on supported VM types. Get more information on the OS releases that support Accelerated Networking along the steps to create a virtual machine with accelerated networking.
Database performance
Once you have eliminated resource contention as a possible root cause, you will need to determine the queries on the database server which are contributing to the highest duration. This can be done using pg_stat_statements module. Since we maintain parity with community PostgreSQL, any native queries that you used to troubleshoot query performance on PostgreSQL will apply on our service as well.
You will be able to execute the below query on an Azure Database for PostgreSQL server to get the top 5 duration queries executed during your performance/benchmarking run:
SELECT query, calls, total_time, rows, 100.0 * shared_blks_hit/
nullif(shared_blks_hit + shared_blks_read, 0) AS hit_percent
FROM pg_stat_statements
ORDER BY total_time
DESC LIMIT 5
It is recommended to reset the pg_stat_statements using the query below to ensure that you only capture the statements from your performance/benchmarking run:
SELECT pg_stat_statements_reset()
Quick tips
If CPU usage for an Azure Database for PostgreSQL server is saturated at 100%, then select the next higher level of Compute Units to get more CPU. For example, if the CPU usage is hovering around 100% continuously during business hours for a Standard 100, then it might be worthwhile to consider Standard 200.
A common issue that we notice is the use of the default included storage size for the database, which is 125GB. The default storage size of 125GB is limited to 375 IOPs. If your application requires higher IOPs, then it is recommended that you create an Azure Database for PostgreSQL server with a higher storage size to get more IOPs so that your application performance is not impacted by storage throttling.
If IO waits are observed from MySQL/PostgreSQL performance troubleshooting, then increasing the storage size should be considered for higher IO throughput. For example, if you observe WALWriteLock as the wait event type for maximum requests using pg_stat_activity, then it would be beneficial to use a server with a higher storage size as storage performance scales with the allocated storage size.
Query to determine the number of waits on WALWriteLock which signifies an IO bottleneck associated with Write Ahead Log writes:
select wait_event, wait_event_type, count(*) as counts
from pg_stat_activity
group by wait_event, wait_event_type;
We recommend having the application server/client machine in the same region and resource group in Azure to reduce between the client/application server and the database.
If you are using pgbench for testing performance, then it is advisable to use a scale factor which is higher than at least the number of connections to ensure that your performance benchmarking is not bottlenecked on update contention. For example, if you are using 100 connections to run pgbench3, then you should at least use a scale factor of 100 or higher.
If there is a resource contention associated with memory or CPU usage on the virtual machine acting as the application server, and all possible optimizations on the application has been implemented, it is recommended to increase the virtual machine size to increase the compute and memory available on the virtual machine.
If there are IO related bottlenecks observed on the virtual machine acting as the application server, it is recommended to increase the disk size hosting the application files and possibly evaluating the use of Premium Managed Disks.
If you are still having a performance issue and need assistance, you have the following options:
- Open a support incident with Microsoft support.
- Post a question on our MSDN forums.
- Send a tweet to @AzureDBforPostgreSQL.
Reference
- Creating a virtual machine with accelerated networking
- Pgbench testing
- More on PostgreSQL performance
- Explaining Compute Units for Azure Database for PostgreSQL
Source: Azure Blog Feed