Spark Debugging and Diagnosis Toolset for Azure HDInsight
Debugging and diagnosing large, distributed big data sets is a hard and time-consuming process. Debugging big data queries and pipelines has become more critical for enterprises and includes debugging across many executors, fixing complex data flow issues, diagnosing data patterns, and debugging problems with cluster resources. The lack of enterprise-ready Spark job management capabilities constrains the ability of enterprise developers to collaboratively troubleshoot, diagnose and optimize the performance of workflows.
Microsoft is now bringing its decade-long experience of running and debugging millions of big data jobs to the open source world of Apache Spark. Today, we are delighted to announce the public preview of the Spark Diagnosis Toolset for HDInsight for clusters running Spark 2.3 and up. We are adding a set of diagnosis features to the default Spark history server user experience in addition to our previously released Job Graph and Data tabs. The new diagnosis features assist you in identifying low parallelization, detecting and running data skew analysis, gaining insights on stage data distribution, and viewing executor allocation and usage.
Data and time skew detection and analysis
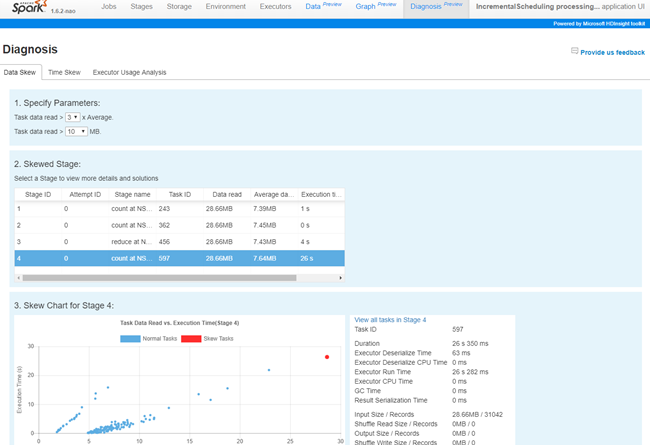
Development productivity is the key for making enterprises technology teams successful. The Azure HDInsight developer toolset brings industry-leading development practices to big data developers working with Spark. Job Skew Analysis identifies data and time skews by analyzing and comparing data input and execution time across executors and tasks through built-in rules and user-defined rules. It increases productivity by automatically detecting skews, summarizing the diagnosis results, and displaying the task distribution between normal and skewed tasks.

Executor Usage Analysis
Enterprises have to manage cost while maximizing performance of their production Spark jobs, especially given the rapidly increasing amount of data that needs to be analyzed. The Executor Usage Analysis tool visualizes the Spark job executors’ allocation and utilization. The chart displays the dynamic change of allocated executors, running executors and idle executors along with the job execution time. The executor usage chart serves as an easy to use reference for you to understand Spark job resource usage and so you can update configurations and optimize for performance or cost.

Getting started with Spark Debugging and Diagnosis Toolset
These features have been built into the HDInsight Spark history server.
- Access from the Azure portal. Open the Spark cluster, click Cluster Dashboard from Quick Links, and then click Spark History Server.
- Access by URL, open the Spark History Server.
Feedback
We look forward to your comments and feedback. If you have any feature requests, asks, or suggestions, please send us a note at hdivstool@microsoft.com. For bug submissions, please open a new ticket using the template.
For more information, check out the following:
-
Use extended Spark History Server to monitor Spark applications
-
Use Azure Toolkit for IntelliJ to debug Spark applications remotely on an HDInsight cluster
Source: Azure Blog Feed