Automatic performance monitoring in Azure SQL Data Warehouse (preview)
Monitoring and managing the performance of your data warehouse is critical to the overall health of your data estate. With the increase in data and query velocities, tracking query metrics pertaining to usage frequency, resource consumption, or regressions can impact your ability to efficiently draw meaningful insights from your data.
To increase your efficiency, we’re excited to reveal the preview of Query Store for Azure SQL Data Warehouse for both our Gen1 and Gen2 offers. Query Store is designed to help you with query performance troubleshooting by tracking queries, query plans, runtime statistics, and query history to help you monitor the activity and performance of your data warehouse. Query Store is a set of internal stores and Dynamic Management Views (DMVs) that allow you to:
- Identify and tune top resource consuming queries.
- Identify and improve ad hoc workloads.
- Evaluate query performance and impact to the plan by changes in statistics, indexes, or system size (DWU setting).
- See full query text for all queries executed.
The Query Store contains three actual stores: a plan store for persisting the execution plan information, a runtime stats store for persisting the execution statistics information, and a wait stats store for persisting wait stats information. These stores are managed automatically by SQL Data Warehouse and provide an unlimited number of queries storied over the last 7 days at no additional charge.
Enabling Query Store
Enabling Query Store is as simple as running an ALTER DATABASE T-SQL statement:
ALTER DATABASE [Database Name] SET QUERY_STORE = ON;
Note: You can disable Query Store by running the ALTER DATABASE command specifying OFF.
Finding the full text for any query
With Query Store, you can retrieve the full text of any query executed over the last 7 days by using the sys.query_store_query and sys.query_store_query_text DMVs.
SELECT
	q.query_id
	, t.query_sql_text
FROM
	sys.query_store_query q
	JOIN sys.query_store_query_text t ON q.query_text_id = t.query_text_id;
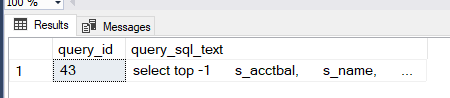
The results show the query_id and the text of the query being executed.

Finding your top executing queries
When enabled, Query Store tracks all query executions. On a busy data warehouse, you may want to look at the top queries by execution count. Using the Query Store views, we can get the query execution count for the 10 commands executed most frequently.
SELECT TOP 10 q.query_id [query_id] , t.query_sql_text [command] , SUM(rs.count_executions) [execution_count] FROM sys.query_store_query q JOIN sys.query_store_query_text t ON q.query_text_id = t.query_text_id JOIN sys.query_store_plan p ON p.query_id = q.query_id JOIN sys.query_store_runtime_stats rs ON rs.plan_id = p.plan_id GROUP BYq.query_id , t.query_sql_text ORDER BY 3 DESC;

Finding the execution times for a query
Query Store also gathers runtime query statistics for you to help you focus on queries with high variance in execution. Using the sys.query_store_plan and sys.query_store_runtime_stats DMVs, we can gather:
SELECT
      q.query_id               [query_id]
      , t.query_sql_text       [command]
      , rs.avg_duration        [avg_duration]
      , rs.min_duration        [min_duration]
      , rs.max_duration        [max_duration]
 FROM
      sys.query_store_query q
      JOIN sys.query_store_query_text t ON q.query_text_id = t.query_text_id
      JOIN sys.query_store_plan p ON p.query_id = q.query_id
      JOIN sys.query_store_runtime_stats rs ON rs.plan_id = p.plan_id
WHERE
      q.query_id = 10
      AND rs.avg_duration > 0;

Finding the queries with the highest variance in execution
WITH RawData AS
(
    SELECT
        q.query_id               [query_id]
        , t.query_sql_text       [command]
        , rs.avg_duration        [avg_duration]
        , rs.min_duration        [min_duration]
        , rs.max_duration        [max_duration]
        , (((rs.max_duration * 1.0)/ (rs.min_duration * 1.0)) - 1) * 100   [variance_pct]
    FROM
        sys.query_store_query q
        JOIN sys.query_store_query_text t ON q.query_text_id = t.query_text_id
        JOIN sys.query_store_plan p ON p.query_id = q.query_id
        JOIN sys.query_store_runtime_stats rs ON rs.plan_id = p.plan_id
    WHERE
        rs.min_duration > 0
)
SELECT
    *
FROM
    RawData
ORDER BY
    variance_pct DESC

Next steps
Query Store is available in all Azure regions with no additional charge. Azure SQL Data Warehouse continues to lead in the areas of security, compliance, privacy, and auditing. For more information, refer to the whitepaper, “Guide to enhancing privacy and addressing GDPR requirements with the Microsoft SQL platform,” on Microsoft Trust Center, or our documentation, “Secure a database in SQL Data Warehouse.”
- For more information on Query Store in Azure SQL Data Warehouse, refer to the article, “Monitoring performance by using the Query Store,” and the Query Store DMVs, such as sys.query_store_query.
- For feature requests, please vote on our UserVoice.
- To get started today, create an Azure SQL Data Warehouse.
- To stay up-to-date on the latest Azure SQL Data Warehouse news and features, follow us on Twitter @AzureSQLDW.
Source: Azure Blog Feed