
Bing Webmaster-Clarity Series #1: What is a heatmap and what does it tell you?
A Heatmap (or heat maps) is a type of data visualization that displays aggregated information in a visually appealing way. User interaction on a website such as clicks/taps, scrolls, mouse movements, etc. create heatmaps. The activity is then scaled (least to most) to give useful data insight.
To display the data, heatmaps use a warm-to-cool schema for their visual representation. As a result, warmer colors (reds) show higher activity while cooler colors (blues) represent lower activity.
The 4 types of website heatmaps
Heatmaps can visualize multiple types of user interactions on a website. The four main types of heatmaps are clicks, scroll, move/hover and attention maps. Each heatmap provides a unique perspective into a user’s journey.
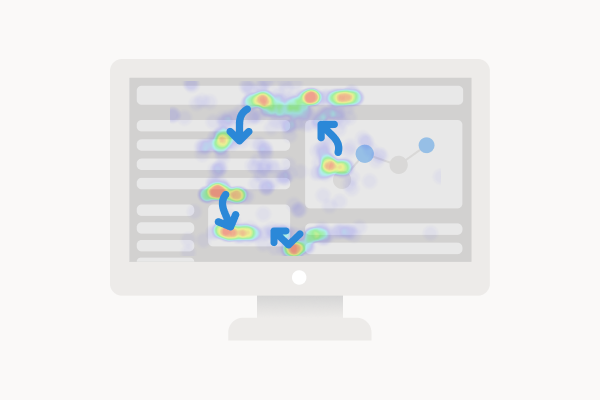
A click heatmap

Click heatmaps (or mouse click heatmaps or taps on mobile devices) display how many clicks and where they happened on your webpage. Understanding where users are clicking (and not clicking) can help a website owner make important decisions on what changes to make to their site.
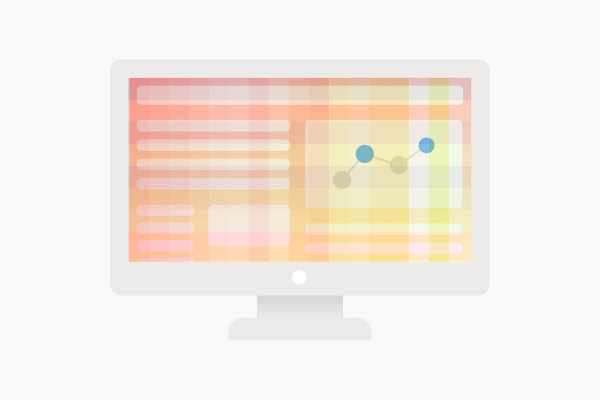
A scroll heatmap

Scroll heatmaps show how far users scrolled down on a webpage. This information can help a website owner know where to place important content on the page for maximizing the number of users to see. Dynamic scroll heatmaps calculate the average scroll depth and the average number of visitors that reached a particular page of the page. If you want to make sure your website visitors are seeing the most important content, scroll heatmaps will let you know.
A move/hover heatmap
Move heatmaps show where visitors hovered their mouse or pointer over your webpage. A webpage visitor might move their mouse to help them read and follow along in an article or leave their mouse in a location while they read the content of the page. Move heatmaps alone cannot give an accurate picture of why the user moved their mouse to a particular location. Click heatmaps are more actionable and generally used more to interpret the visitor’s intention.
An attention heatmap
Attention heatmaps combine multiple types of interaction data to provide an aggregated view of the visitor’s activity. Attention heatmaps include number of clicks, how they happened, the parts of the page which were reached and mouse movement on the page. The length of time across all these activities can be summarized into an attention heatmap.
In summary heatmaps tell you:
- What content interests your users most? – click heatmaps
- Are visitors are seeing your most important content of your page? – scroll heatmaps
- How are users navigating across your webpage? – move heatmaps
- What part of your webpage does the user interact with? – attention heatmaps
Microsoft Clarity offers dynamic click and scroll heatmaps across desktop, tablet and mobile.
How is a website heatmap generated?
Heatmaps are generated from the data they aggregate over. It is important to understand how the data is aggregated on a heatmap to best understand how the data is being represented.
The traditional method of making a click heatmap generates heat by recording an X and Y position of mouse clicks. As a result, all the clicks in the X and Y position are counted to generate the intensity of heat. Then, heat is overlaid on top of a static representation of your website. This methodology does not scale well for different screen resolutions, dynamic HTML elements, single-page apps, dropdown menus, etc.
Clarity uses an advanced heatmap generation process with intelligent HTML element detection, based on a website’s DOM. For click maps, Clarity detects clicks on specific tags, CSS classes, parent nodes, etc. and aggregates them by element. The aggregated data allow heatmapping to be drawn relative to these elements rather than on X/Y coordinates. For scroll maps, Clarity considers the page length and how far the user scrolled across multiple pages.
Clarity’s heatmaps are dynamic. As a result, they are capable of displaying interactions based on elements that exist at different points in time. This way you can visualize clicks at different stages of the page’s existence.
5 things to learn from a heatmap
Heatmaps on your site can help with gaining various insights about your users.
1. Heatmaps can help create baselines for current visitor experiences
Keep track of progress by comparing your visitors’ experiences on your site before and after making changes. This will help you understand the impact of your site improvements and updates.
2. Heatmaps can help identify content trends on your website
Know your visitors’ favorite content. Over time so you can give your visitors’ more of what they want and less of what they don’t.
3. Heatmaps can help validate content ranking on your page
Design more effective website layouts. By letting heatmaps tell you how each element on your page ranks in its user engagement.
4. Heatmaps can help identify what not to change when resources are limited
Make decisions to prioritize issues having the greatest impact on user experience and sales conversion.
5. Heatmaps showcase effects of changes made by flighting/experimentation.
With heatmaps, you don’t have to guess about which branch of an experiment is the high performer. Heatmaps visualized it for you.
Clarity’s website heatmaps
Microsoft Clarity offers dynamic heatmaps for clicks and scrolls. They can be generated on every page of your site—without slowing down your website’s performance. Clarity’s heatmaps work with virtually every HTML element on your site. This lets you see the ways that people interact with your site.
Clarity is free for your site and it’s super easy to setup. Sign up now.
Source: Bing Blog Feed