Advancing Azure Virtual Machine availability transparency
“Throughout our Advancing Reliability blog series we’ve explained various techniques used by the Azure platform to prevent technical issues from impacting customers’ virtual machines (VMs) or other resources—like host resiliency with Project Tardigrade, cautious safe deployment practices taking advantage of ML-based AIOps insights, as well as predicting and mitigating hardware failures with Project Narya. Despite these efforts, when operating at the scale of Azure we know that there will inevitably be some failures that impact customer resources—so when they do, we strive for transparency in how we communicate to impacted customers. So for today’s post in the series, I have asked Principal Software Engineering Manager Nick Swanson to highlight recent improvements in the space—specifically, how we surface more detailed root cause statements via Azure resource health.”— Mark Russinovich, CTO, Azure
The existing Azure resource health feature helps you to diagnose and get support for service problems that affect your Azure resources. It reports on the current and past health of your resources, showing any time ranges that each of your resources have been unavailable. But we know that our customers and partners are particularly interested in “the why” to understand what caused the underlying technical issue, and in improving how they can receive communications about any issues—to feed into monitoring processes, to explain hiccups to other stakeholders, and ultimately to inform business decisions.
Introducing root causes for VM issues—in Azure resource health
We recently shipped an improvement to the resource health experience that will enhance the information we share with customers about VM failures, with additional context on the root cause that led to the issue. Now, in addition to getting a fast notification when a VM’s availability is impacted, customers can expect a root cause to be added at a later point once our automated Root Cause Analysis (RCA) system identifies the failing Azure platform component that led to the VM failure. Let’s walk through an example to see how this works in practice:
- At time T1, a server rack goes offline due to a networking issue, causing VMs on the rack to lose connectivity. (Recent reliability improvements related to network architecture will be shared in a future Advancing Reliability blog post—watch this space!)
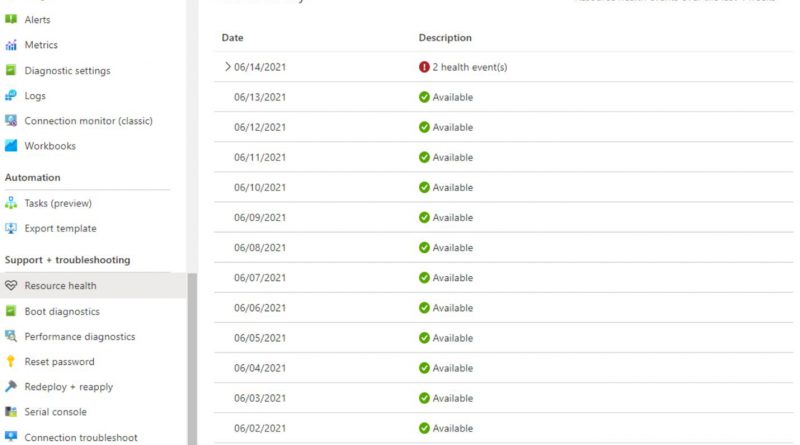
- At time T2, Azure’s internal monitoring recognizes that it is unable to reach VMs on the rack and begins to mitigate by redeploying the impacted VMs to a new rack. During this time, an annotation is sent to resource health notifying customers that their VM is currently impacted and unavailable.

Figure 1: A screenshot of the Azure portal “resource health” blade showing the health history of a resource.
- At time T3, platform telemetry from the top of rack switch, the host machine, and internal monitoring systems, are all correlated together in our RCA engine to derive the root cause of the failure. Once computed, the RCA is then published back into resource health along with relevant architectural resiliency recommendations that customers can implement to minimize the probability of impact in the future.


Figure 2: A screenshot of the Azure portal "health history" blade showing root cause details for an example of a VM issue.
While the initial downtime notification functionality has existed for several years, the publishing of a root cause statement is a new addition. Now, let’s dive into the details of how we derive these root causes.
Root Cause Analysis engine
Let’s take a closer look at the prior example and walk through the details of how the RCA engine works and the technology behind it. At the core of our RCA engine for VMs is Azure Data Explorer (ADX), a big data service optimized for high volume log telemetry analytics. Azure Data Explorer enables the ability to easily parse through terabytes of log telemetry from devices and services that comprise the Azure platform, join them together, and interpret the correlated information streams to derive a root cause for different failure scenarios. This ends up being a multistep data engineering process:
Phase 1: Detecting downtime
The first phase in root cause analysis is to define the trigger under which the analysis is executed. In the case of Virtual Machines, we want to determine root causes whenever a VM unexpectedly reboots, so the trigger is a VM transitioning from an up state to a down state. Identifying these transitions from platform telemetry is straightforward in most scenarios, but more complicated around certain kinds of infrastructure failure where platform telemetry might get lost due to device failure or power loss. To handle these classes of failures, other techniques are required—like tracking data loss as a possible indication of a VM health transition. Azure Data Explorer excels at this time of series analysis, and a more detailed look at techniques around this can be found in the Microsoft Tech Community: Calculating downtime using Window functions and Time Series functions in Azure Data Explorer.
Phase 2: Correlation analysis
Once a trigger event is defined (in this case, a VM transitioning to an unhealthy state) the next phase is correlation analysis. In this step we use the presence of the trigger event to correlate telemetry from points across the Azure platform, like:
- Azure host: the physical blade hosting VMs.
- TOR: the top of rack network switch.
- Azure Storage: the service which hosts Virtual Disks for Azure Virtual Machines.
Each of these systems has their own telemetry feeds that need to get parsed and correlated with the VM downtime trigger event. This is done through understanding the dependency graph for a VM and the underlying systems that can cause a VM to fail, and then joining all these dependent systems’ health telemetry together, filtered on events that are relatively close to the VM transition in time. Azure Data Explorer’s intuitive and powerful query language helps with this, with documented patterns like time window join for correlating temporal telemetry streams together. At the end of this correlation process, we have a dataset that represents VM downtime transitions with correlated platform telemetry from all the dependent systems that could cause or could have information useful in determining what led to the VM failure.
Phase 3: Root cause attribution
The next step in the process is attribution. Now that we’ve collected all the relevant data together in a single dataset, attribution rules get applied to interpret the information and translate it into a customer-facing root cause statement. Going back to our original example of a TOR failure, after our correlation analysis we might have many interesting pieces of information to interpret. For example, systems monitoring the Azure hosts might have logs indicating they lost connectivity to the hosts during this time. We might also have signals related to virtual disk connectivity problems, and explicit signals from the TOR device about the failure. All these pieces of information are now scanned over, and the explicit TOR failure signal is prioritized over the other signals as the root cause. This prioritization process, and the rules behind it, are constructed with domain experts and modified as the Azure platform evolves. Machine learning and anomaly detection mechanisms sit on top of these attributed root causes, to help identify opportunities to improve these classification rules as well as to detect pattern changes in the rate of these failures to feed back into safe deployment pipelines.
Phase 4: RCA publishing
The last step is publishing root causes to Azure resource health, where they become visible to customers. This is done in a very simple Azure Functions application, which periodically queries the processed root cause data in Azure Data Explorer, and emits the results to the resource health backend. Because information streams can come in with various data delays, RCAs can occasionally be updated in this process to reflect better sources of information having arrived leading to a more specific root cause that what was originally published.
Going forward
Identifying and communicating to our customers and partners the root cause of any issues impacting them, is just the beginning. Our customers may need to take these RCAs and share them with their customers and coworkers. We want to build on the work here to make it easier to identify and track resource RCAs, as well as easily share them out. In order to accomplish that, we are working on backend changes to generate unique per-resource and per-downtime tracking IDs that we can expose to you, so that you can easily match downtimes to their RCAs. We are also working on new features to make it easier to email RCAs out, and eventually subscribe to RCAs for your VMs. This will make it possible to sign up for RCAs directly in your inbox after an unavailability event with no additional action needed on your part.
Source: Azure Blog Feed