Elastic and Microsoft Azure: Unified Observability for Spring Boot applications
Today, we are announcing the availability of Elastic integrations for unified observability of Spring Boot applications on Azure. You can seamlessly ship Microsoft Azure Spring Cloud logs and metrics into Elastic, instrument Spring Boot applications, and monitor every step of your cloud journey. You also get a holistic view across Spring Boot applications and other logs and metrics in your cloud and on-premises environments.
Over the past two years, we worked with many enterprise customers to learn about the scenarios they face. Many of these customers have thousands of Spring Boot applications running in on-premises data centers. As they migrate these applications to the cloud, they need to aggregate logs and metrics from these applications and instrument them for application performance monitoring (APM) using solutions their developers are familiar with and have been using for years. In addition, they must ensure continuity for existing server-side software that are already shipping logs and metrics and are pre-instrumented for end-to-end monitoring using systems like Elastic. You can gain deeper application visibility, reduce the time spent on root cause analysis, and provide a consistent customer experience in your web and mobile applications. Learnings from a 2021 survey also indicated that “end-to-end monitoring” is the second biggest challenge DevOps and IT managers face as they migrate Spring Boot applications to the cloud. With the integration of Azure Spring Cloud logs and metrics in Elastic, you can streamline your journey and easily instrument your Spring Boot applications for unified observability.

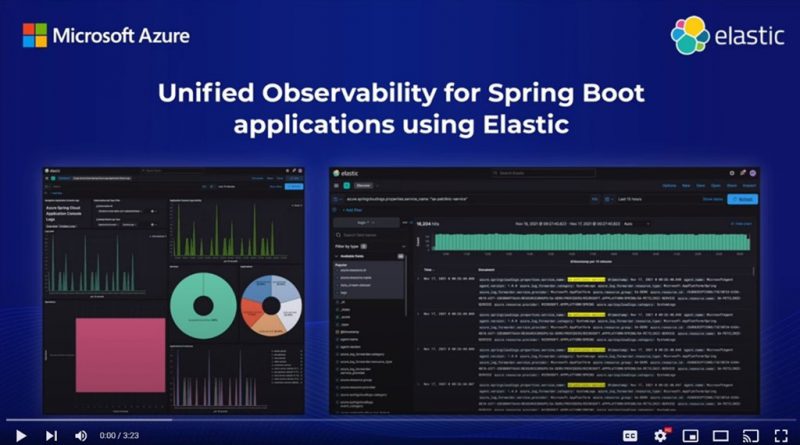
Figure 1: Video screenshot with dashboards showing observability for Spring Boot applications using Elastic
Elastic can now seamlessly ingest logs and metrics from Microsoft Azure Spring Cloud so that DevOps and SREs can monitor their Spring Boot applications—whether in the cloud, on-premises. or in hybrid environments—and remove monitoring silos to increase operational efficiency and developer productivity. DevOps and SREs can monitor both Spring Boot logs and application metrics across all environments by automatically shipping them to Elastic. Teams can also correlate and add context to their Spring data with other observability data sets across their environments for holistic end-to-end monitoring.
"Microsoft is committed to making it easier for customers to modernize their Java applications in the cloud. The expanded native integration of Elastic on Azure includes support for Azure Spring Cloud that enables customers to simply achieve end-to-end observability of their Spring Boot applications."—Julia Liuson, President, Developer Division, Microsoft
Shipping Azure Spring Cloud logs to Elastic
Native integration makes it seamless to ship logs to the Elastic Observability solution. Once data is shipped into Elastic, you can jumpstart analysis in minutes with turnkey visualizations and dashboards.

Figure 2: Diagnostic Setting blade for Azure Spring Cloud Service
Instrumenting Spring Boot applications
Run a "provisioning" automation for a completely hands-off experience for instrumenting and monitoring any new applications that you create and deploy using Elastic’s Terraform or ARM template. Or you can run it on-demand using the Azure command-line interface (CLI) for greater flexibility and control.

Figure 3: Example of setting up Elastic instrumentation using the Azure CLI (command-line interface)
Analyzing Spring Boot application performance
After instrumenting and shipping logs from your Spring Boot application, you can use Elastic Observability to monitor, analyze, and search your data to keep your applications performing.
You can also use the out-of-the-box Azure Spring Cloud dashboards within Elastic Observability to gain instant insights from your Azure Spring Cloud logs.

Figure 4: Out-of-the-box dashboards for Azure Spring Cloud Service logs in Elastic Observability
With Elastic application performance monitoring (APM), you can analyze and search your application performance data.

Figure 5: Service Map for customer-service from Spring Petclinic Application
You can also use Elastic APM to look at Java Virtual Machine (JVM) metrics to understand heap memory usage, system memory usage, CPU usage, and other metrics that help you make evidence-based capacity planning decisions.

Figure 6: JVM metrics in Elastic APM for customers-service
Utilizing the distributed tracing capabilities of Elastic APM, you can drill further into the performance of your applications to understand which transactions impact your customers the most and wherein those transactions is the most time being spent.

Figure 7: Distributed tracing in Elastic APM for customers-service's GET owners operation
Machine learning automatically detects anomalies
With Elastic’s built-in machine learning capabilities, extracting new insights from your Azure Spring Cloud data is as simple as clicking a button—making machine learning truly operational.
The Elastic Stack processes data upon ingestion, ensuring that you have the metadata you need to identify root causes or add context to any event. Built-in tools like Data Visualizer help you find the jobs you're looking for and identify fields in your data that would pair well with machine learning.
You can derive actionable insights from your logs and APM data with the rich alerting and anomaly detection capabilities within Elastic Observability. For example, you can uncover irregular log rates or unusual behavior in the response times of your applications in Azure Spring Cloud

Figure 8: Anomaly Explorer in Elastic
Use the same logs to stop threats at cloud scale
Since Elastic offers a common schema and single repository, the same observability data from Spring applications and other data sets can also be used for extended detection and response (XDR) to drive mean time to detection towards zero. Elastic Security brings together security information and event management (SIEM) and endpoint security, allowing organizations to ingest and retain large volumes of data from diverse sources, store and search data for longer, and augment threat hunting with detections and machine learning.
Focus on customer value while we keep the lights on
The native integration of Elastic in Azure is the easiest and fastest way to get started with Elastic on Azure. Quickly ship your Azure Spring Cloud logs and APM data to Elastic, access any type of data, from anywhere, when you need it the most—whether your data is on-prem, or in multi-cloud or hybrid cloud environments. This holistic view helps streamline migrating your Spring Boot applications to the cloud. Plus, Elastic Cloud handles the security, maintenance, and upkeep, allowing you to drive your business forward with increased visibility, improved operations, and cyber resilience.
Build your solutions and monitor them today
Azure Spring Cloud is jointly built, operated, and supported by Microsoft and VMware. It is a fully managed service for Spring Boot applications that abstracts away the complexity of infrastructure and Spring Cloud middleware management, so you can focus on building your business logic and let Azure take care of dynamic scaling, patches, security, compliance, and high availability. With a few steps, you can provision Azure Spring Cloud, create applications, deploy, and scale Spring Boot applications, and start monitoring in minutes. We will continue to bring more developer-friendly and enterprise-ready features to Azure Spring Cloud. We would love to hear how you are building impactful solutions using Azure Spring Cloud.
Analyze logs and metrics and monitor your Spring Boot applications with Elastic!
Resources
- Learn using an MS Learn module or self-paced workshop on GitHub
- Learn more about implementing solutions on Azure Spring Cloud
- Deploy a distributed version of Spring Petclinic application
- Deploy Spring Boot applications by leveraging enterprise best practices through Azure Spring Cloud Reference Architecture
- Migrate your Spring Boot, Spring Cloud, and Tomcat applications to Azure Spring Cloud
- Wire Spring applications to interact with Azure services
- For feedback and questions, please email us.
Source: Azure Blog Feed